
Financial Summary
The following graphs and tables show five years of major sources of revenues and expenditures for the City. The data comes from the audited year-end actuals in the City’s Annual Financial Report. Revenue trends show steady increases with the City’s population growth. In 2014, The City acquired the Chisholm Trail Special Utility District which added 7,500 new water customers and over 375 square miles of new service territory. Expenditures also generally trend upward with population growth; however, expenditures can vary significantly from year to year due to changes in the Capital Improvement Plan.
The City’s property tax rate is currently the lowest in Central Texas at 41.8 cents per $100 of assessed valuation. While the city’s property tax rate has hovered around 42 cents for the past five years, the revenue from property taxes have increased along with the increases in the assessed value of property. The City sales tax rate is 2%. Sales tax revenue has also increased over the five year period due to increases in population and tourism.
A major source of operational expenditure is the City’s personnel. Over the past five years, the City’s total number of personnel has increased by more than 80 full-time equivalent positions. The bulk of this increase is related to the acquisition of the Chisolm Trail water system, the establishment of Emergency Medical Services, and two new fire stations.
For more information about the City’s revenue and expenditures, click here to check out the Budget in Brief.
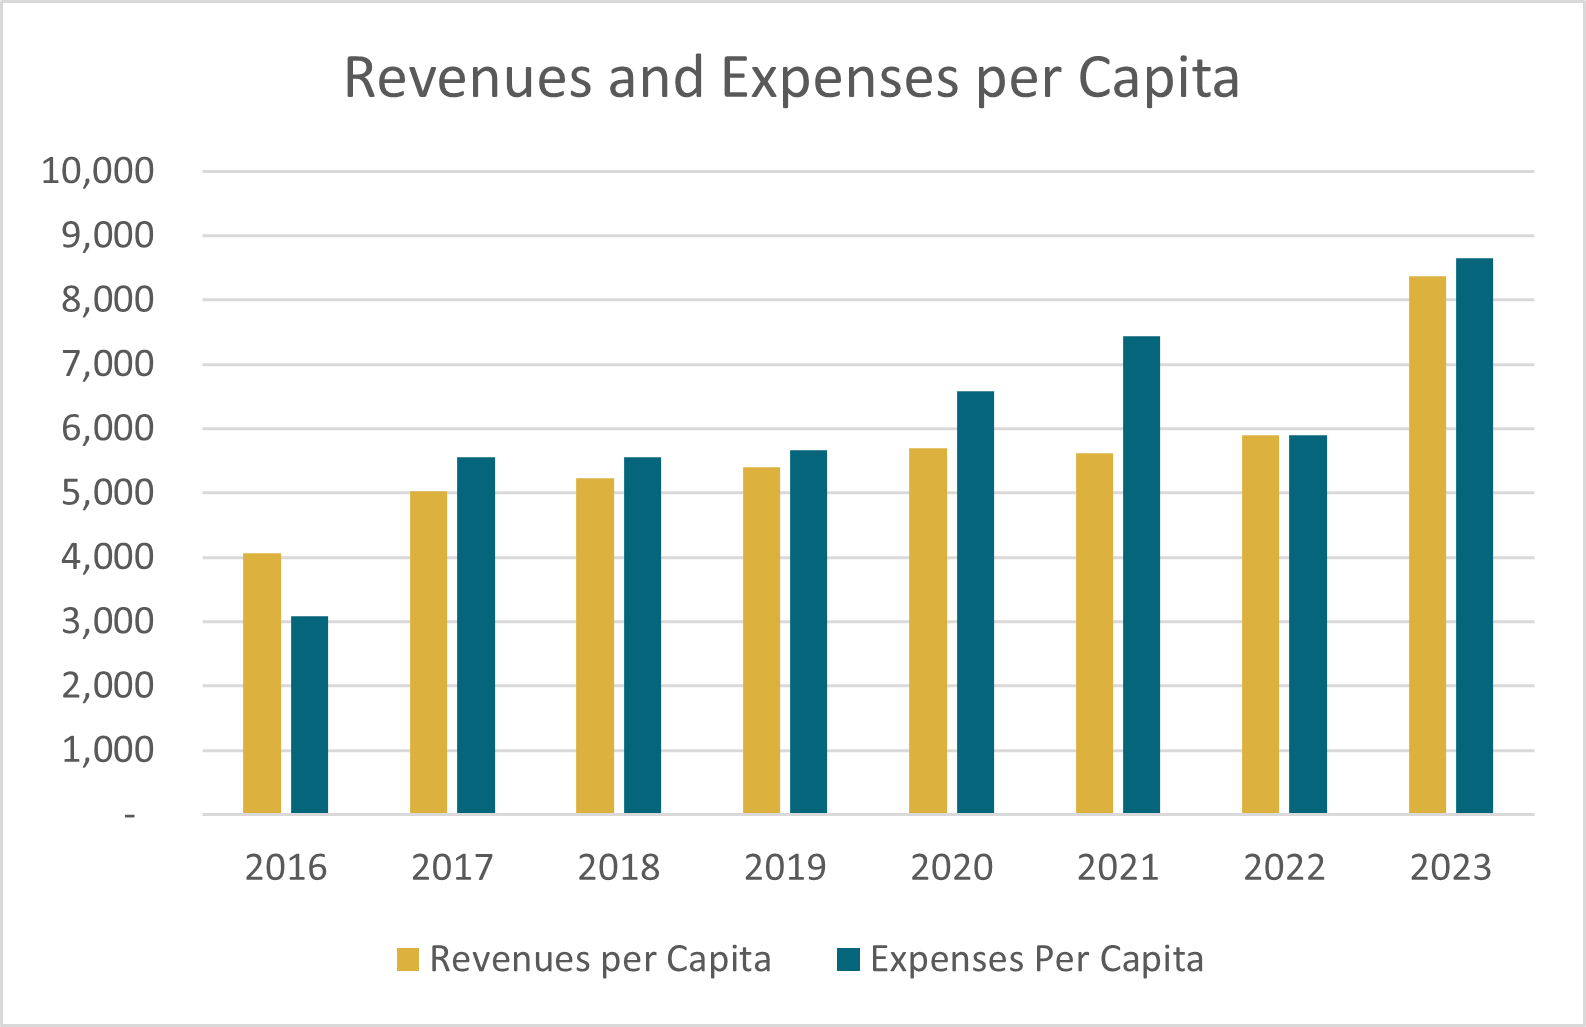
Revenues
| Revenues (Budgeted) | 2019 | 2020 | 2021 | 2022 | 2023 |
| Governmental Activities | 65,045,841 | 66,155,886 | 124,481,661 | 171,004,,461 | 219,083,385 |
| Business-type Activities | 202,493,550 | 236,801,630 | 239,484,544 | 221,841,807 | 372,834,562 |
| General Revenues | 70,162,863 | 75,483,881 | 83,206,421 | 90,772,990 | 107,293,649 |
| Total Revenues | 337,702,254 | 378,441,397 | 447,172,646 | 483,619,258 | 699,211,596 |
| Population | 62,500 | 66,466 | 79,604 | 81,942 | 83,529 |
| Per Capita Revenue | 5,403 | 5694 | 5617 | 5902 | 8371 |
Expenses
| Expenses (Budgeted) | 2019 | 2020 | 2021 | 2022 | 2023 |
| Governmental Activities | 143,478,949 | 157,084,212 | 266,339,275 | 258,649,923 | 329,466,029 |
| Business-type Activities | 210,770,310 | 280,849,867 | 326,061,509 | 224,138,780 | 393,410,315 |
| Total Expenses | 354,249,259 | 437,934,079 | 592,400,784 | 482,788,703 | 722,876,344 |
| Population | 62,500 | 66,466 | 79,604 | 81,942 | 83,529 |
| Per Capita Expense | 5,668 | 6,588 | 7,442 | 5,892 | 8,654 |
City of Georgetown, Texas
Full Time Equivalent City Government Employees By Function
Click here for a downloadable PDF of Position Control for FY 2019 – FY 2022.
Note: A full-time employee is scheduled to work 2,080 hours per year (including vacation and sick leave). Full-time equivalent employment is calculated by dividing total labor hours by 2,080.